A Responsive App to Record Cushion Data
We created a responsive app that seamlessly tracked cushion pressure whilst someone was sitting on it to monitor their movements. The app was designed to be available to clinicians and would synchronise to the firmware device. By collecting data whilst connected, clinicians can monitor their patients’ movements remotely and advise them on distributing pressure to improve their physical health and prevent injury.
Front End Uses
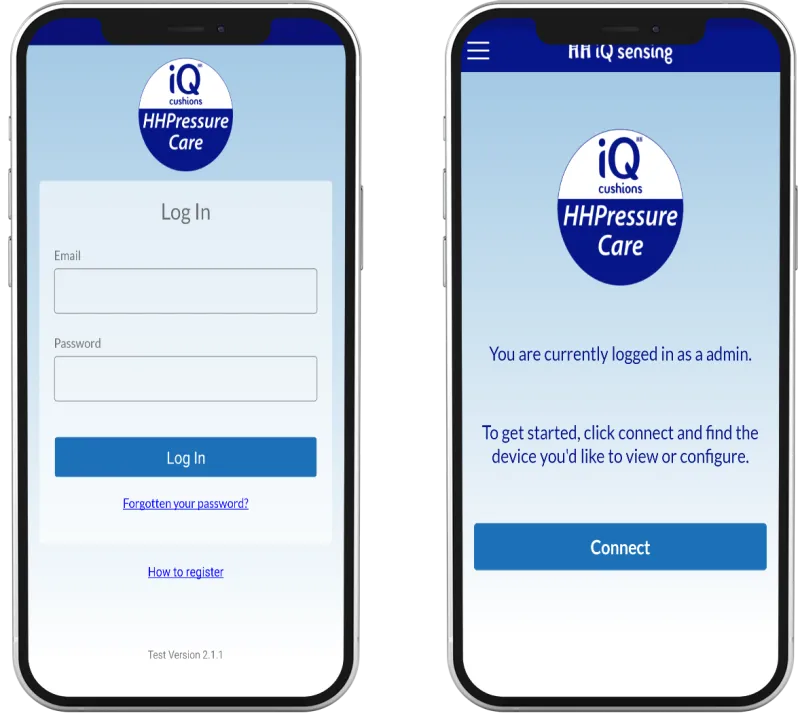
Via the front end, clinicians can log in to the app using their account information. They can then easily connect to the firmware device (the cushion) via an easy and stable Bluetooth connection. This can then be set up for the user, too, helping them navigate the app with ease so that they can use the firmware and the app correctly. Once the user begins to use the app, clinicians can view and manage the data via the user management page. The whole front end is designed with easy navigation and a user-friendly interface.

View Data Collected Via Graphs
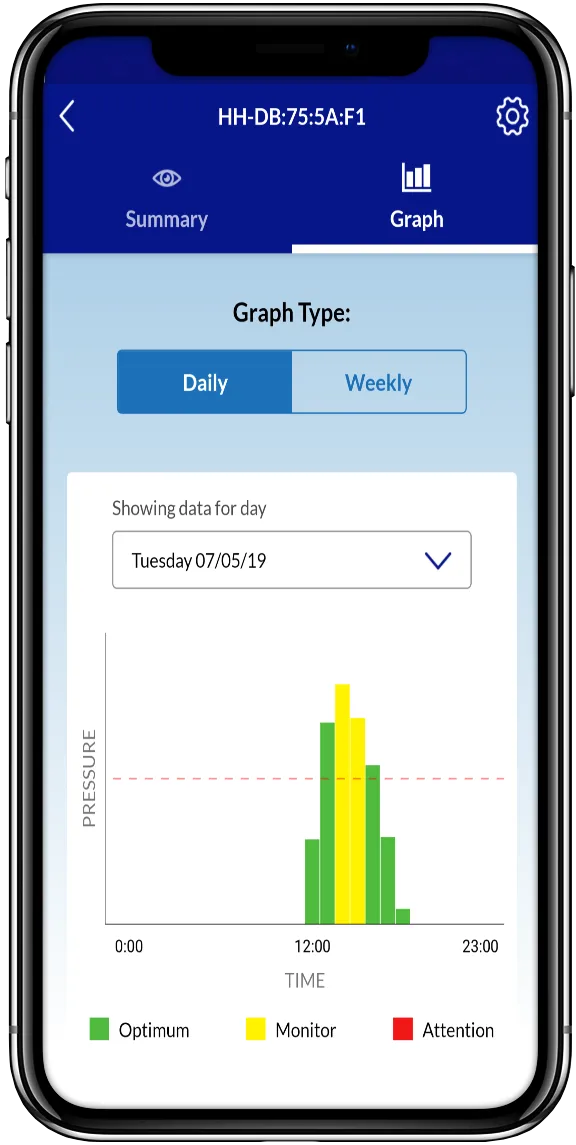
As the app works, it collects a wealth of data. We needed to make this readable for the clinicians to log into the app and quickly receive valuable insights. To do that, we built coloured graphs that the data will be transferred to. The clinician can see the data gathered so far in either a daily or weekly format from these. It’s easy to interpret, which reduces error and is quick to understand, helping clinicians use their time effectively.
An Alarm For Changing Risk Categories
If a patient is injured or has ill health, we built an alarm that can be turned on. If the monitor detects a change in pressure has increased the patient’s risks, such as if they’ve moved into a position that could be harmful, the alarm will go off. This can alert both patients and clinicians of the change in risk, keeping the user as safe as possible.
Intelligent Synchronisation of Data
On the back end, we built an intelligent synchronisation process into the application. This allows the app to automatically sync with the firmware device via Bluetooth, receiving data in batches. This data is then formulated into hour blocks, the information is stored, and it syncs to the app to build the graph that will then be displayed on the front end.
The Technology Stack
For the tech stack of this app, we used React Native for the front end and Yii2 PHP for the back end.

